| HARFA: SCREENSHOTS AND TUTORIALS: INPUT FROM THERMOCAMERA |
| |
Thermocamera Fluke TI55 (HarFA 5.4 version)
Analysis of Thermocamera Fluke data can be done in three steps: conversion of data to numerical data by SmartView software, reading of numerical data as Image or video to HarFA 5.4 and analysis of Image data by HarFA 5.4 software
Thermocamera data preparation for reading by HarFA 5.4
The reading of data from thermocamera Fluke TI55 (*.is2) can be done in two steps:
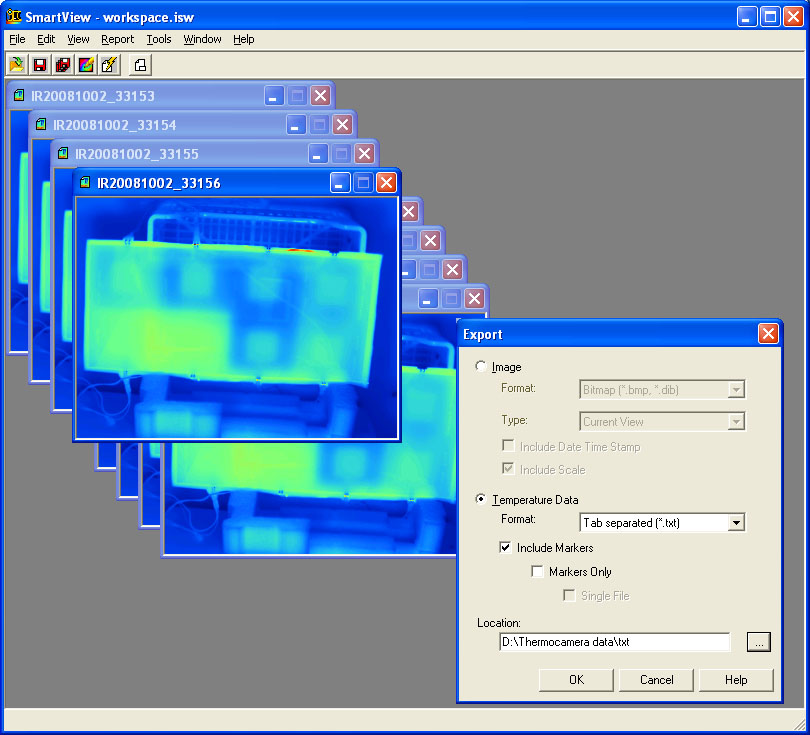
a) Reading by SmartView software (Fluke firmware) as sequences of images,
b) Exporting as Temperature data (matrix of 320 x 240 values) to *.txt file and the extension must be changed to *.ist for further analysis by HarFA 5.4 software,
Reading of data to HarFA 5.4 for further analysis and its imaging
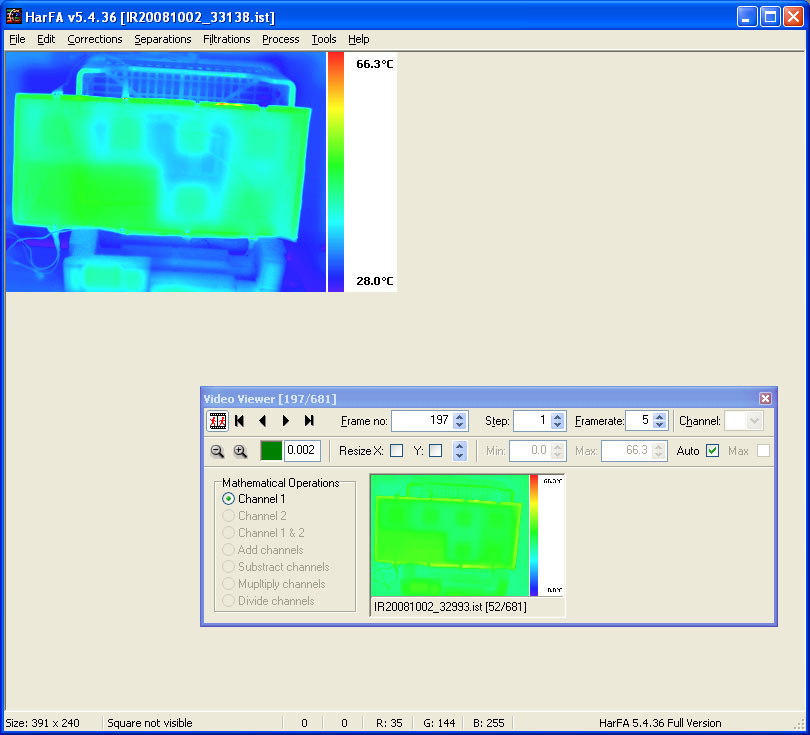
The exported numerical text data from SmartView software (*.ist) can be red and Imaged in HarFA 5.4 software as Image or as video. The Video Viewer provide selecting of the Image (frame of video), setting parameters for creating of video (*.avi), setting Image parameters before analysis (e.g. Resize, Min, Max) and mathematical operations with two images. The example of reading is done in three steps:
a) Opening by HarFA 5.4 software for further analysis as Image or sequences of images (File/Open Video...)
b) Selecting of Temperature data files as images (frames of video) for further analysis
c) Viewing set of temperature data as video by VideoViewer
Thermocamera data analysis
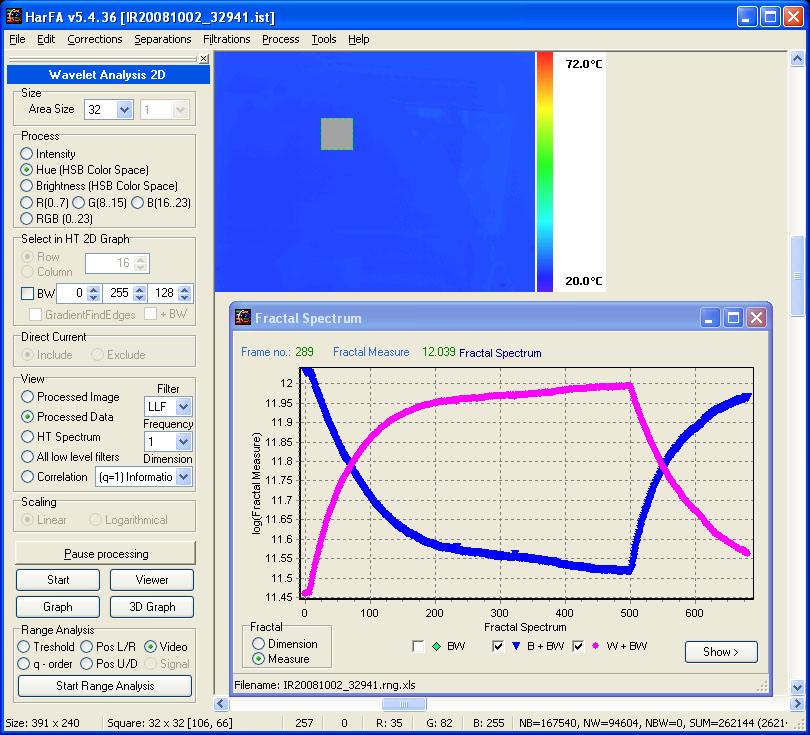
The determination of fractal parameters (fractal measure K and fractal dimensions D) can be act for evaluating of average temperature and q-order deviation (absolute deviation, standard deviation, ...) at selected square. 2D wavelet analysis selected from menu File/Process can be used for the data processing. The applicable formats for analysis are Hue (8 bits) or RGB (24 bits)
a) Linear regression graph calculated after selecting Processed Data (View) represents dependences for determination of the fractal parameters calculated for square 32 x 32 pixels (Size), Hue Color space (Process), not tresholded analysis (Select in HT 2D Graph).
b) The dependences of Fractal measure K and Fractal dimension D of BBW and WBW squares were calculated for all selected sets (frames) by Start range analysis. The result of fractal measures give information about average temperature in selected square, the fractal dimensions about their constancy (ideal value is 3).
c) The dependences of Fractal measure K and Fractal dimension D of BW squares give information about average deviation (q = 1) and constancy of temperature (ideal value is 2).
Previous
Next
|
|
|