| HARFA: SCREENSHOTS AND TUTORIALS: 2D FOURIER TRANSFORM |
| |
Harmonic Analysis
2D Fourier transformation
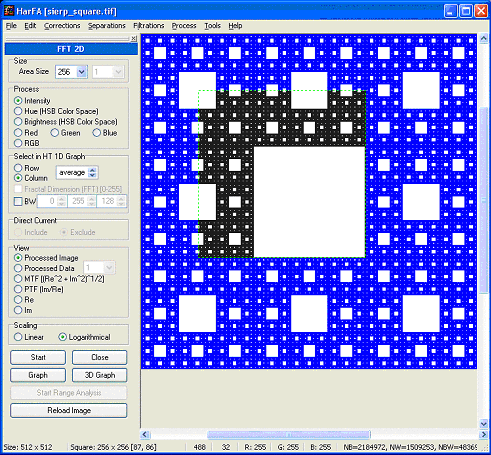
Let's process a part of Sierpinski carpet (loaded image) by the 2D Fourier transform. The area to be processed is defined by the green dashed border and can be moved by the mouse. The selected area contains 256x256 pixels. The input sequence can be obtained in three directions (by rows, columns, or both). After pressing the Start button you can view MTF, PTF, Re and Im part of Fourier spectra as
1D graph or
2D graph (intensity function). Many image spectra decrease rather rapidly as a function of increasing frequency and therefore their high frequency terms have a tendency to become obscured when displayed as a linear function of the Fourier spectrum. Therefore, there is a possibilty to show the results as a
logarithmical function or to show just a selected part of the Fourier spectrum (Partial scaling). You can also check the input sequence (processed data). The results and processed image can be viewed as
3D graphs,
which can be colorized, zoomed, rotated and shifted.
Previous
Next
|
|
|