| HARFA: SCREENSHOTS AND TUTORIALS: 1D HAAR TRANSFORM |
| |
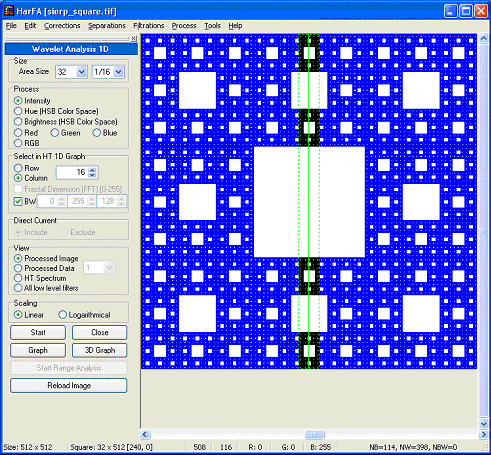
Wavelet Analysis
1D Haar transformation
Let's process a
Cantor discontinuum (vertical green line in loaded image) by the 1D Haar transform. The area to be processed is defined by the green dashed border and it can be moved by the mouse. The selected area contains 32x256 pixels. User have to select a method to fill input data sequence (256 values). You can process the average of the image rows (intensity, hue, brightness or one of RGB channels), average of the image columns or certain row or column. You can also view the selected input sequence. After pressing the Start button you can view the
fractal parameters,
Haar transform spectrum or
All low level filters,
or part of the Haar spectra as 1D graph. You can also check the
input sequence (processed data). The graphical data can be saved as text file.
Previous
Next
|
|
|