| HARFA: SCREENSHOTS AND TUTORIALS: ACOUSTIC SIGNAL ANALYSIS - HT |
| |
Fractal Analysis
Acoustic Signal Analysis - based on 1D Haar transformation (HarFA 5.2)
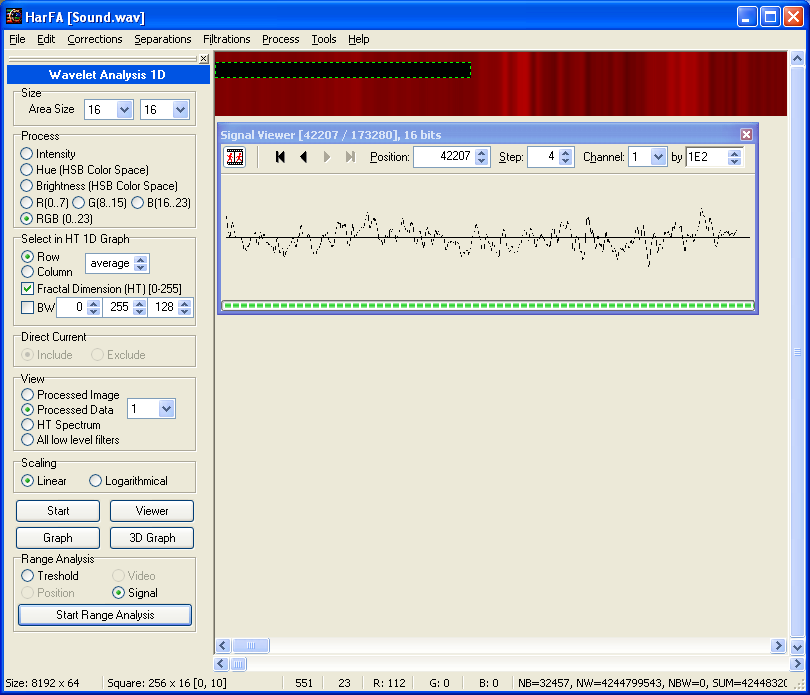
Wavelet Analysis of 1D acoustic signal (RGB: values 0...16777216, BW not tresholded signal)
a) Sound Viewer (Acoustic Channel: 1 by exponent 1E2, Step: 4 of worm shift)
b) HT 1D Graph of acoustic signal (Average signal in Area Size of height 16 and width 16 x 16 = 256)
c) Fractal Analysis of HT 1D Graph data (Processed Data), the linear regression coefficients are fractal dimensions (for signal 1 <= D <= 2) and logarithm of the fractal measures
d) Fractal Spectrum (Range Analysis: Signal)
Previous
Next
|
|
|